Dashboards
The Dashboards page provides you with several tabs that offer an overview of your company, all relevant activity, recent security events, and more.

Company selection. Company selector for which you want to display information.
Date selection. Selector for a predetermined time interval, relative to the current time:
Last 24 hours
Last 7 days
Last 30 days
Info button - hyperlink to the knowledge base article relevant for the page displayed.
Notifications. Allows you to configure notification settings for your company.
Org. Summary. A high-level overview of endpoint and license status, incidents, investigations, and recommendations for all your managed companies.
Overview. General information about the overall security status of your company and the most recent relevant events.
MDR service. Statistics, lists and information regarding all recent Bitdefender MDR activity performed by the SOC team.
Agent actions. An overview of alerts, incidents and threats that resulted from agent actions.
Configuration. General Bitdefender MDR service status information.
Org. Summary
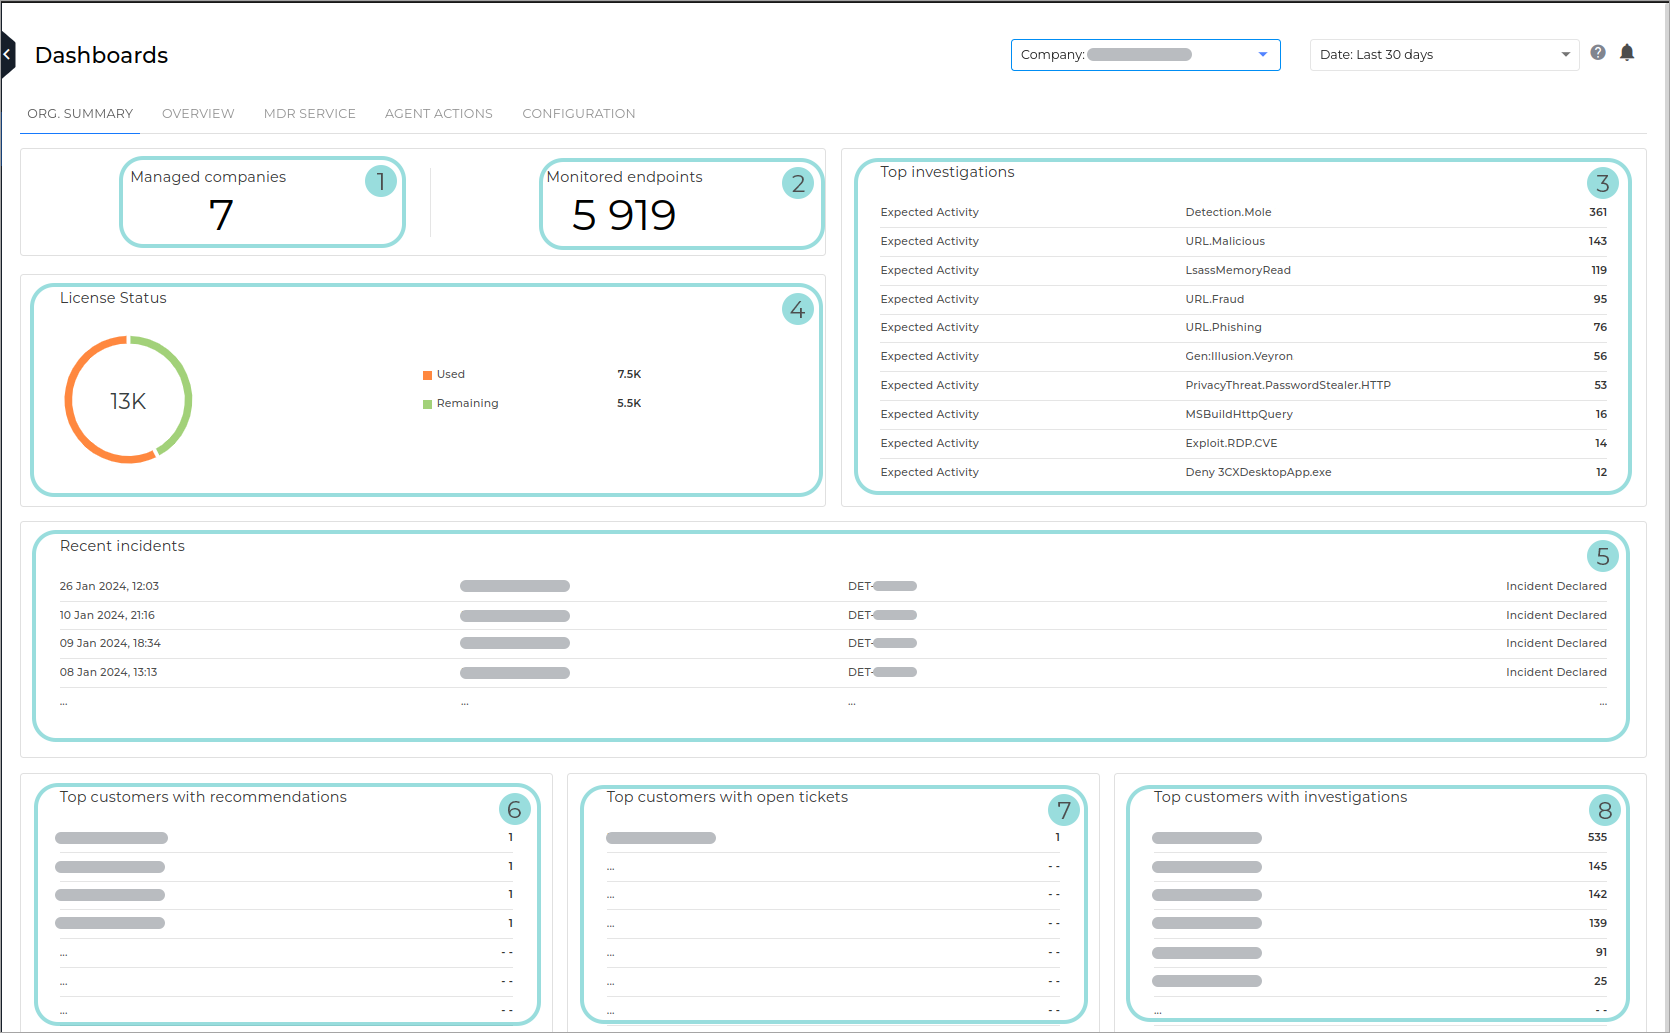
The Org. Summary A high-level overview of endpoint and license status, incidents, investigations, and recommendations for all your managed companies.
The sections are presented in the order that they appear in the console, from top to bottom. The page is separated by title blocks for their respective data sets.
Managed companies. Shows the total number of companies that meet the following requirements:
For yearly licenses
For monthly subscriptions
The total number of customer-type companies which currently have active licenses that provide access to the Bitdefender MDR service, for which the Onboarding process has finished.
This number does not include the parent company.
The total number of customer-type companies which currently have the Bitdefender MDR Foundations service enabled for own use in GravityZone, for which the Onboarding process has finished.
This number does not include the MSP itself.
Tip
Click the title to view Companies page.
Monitored endpoints. Shows the total number of monitored endpoints for your managed companies.
Endpoints are considered monitored if they send telemetry at least once during the current month.
Top investigations. Shows the highest number of investigations, by type.
For more information on investigation types, refer to Investigations.
Tip
Click the title to view the Investigations page.
Click a specific investigation type from the list to go to the Investigationpage, which displays only the type of investigation you have selected.
License Status. Displays the licensing information for your company. The following information is included:
Total - The total number of endpoints managed in GravityZone. This number is based on the following criteria:
For yearly licenses
For monthly subscriptions
The total number of endpoints licensed in GravityZone for all managed companies.
The total number of reserved seats, if available.
If not seats are reserved for the company, the monthly endpoint usage is displayed for the current month.
Used - The number of endpoints which count towards Bitdefender MDR usage for all managed companies. Usage is calculated as follows:
For yearly licenses
For monthly subscriptions
The total number of endpoints that are currently using a license in GravityZone.
The number of endpoints that have had EDR enabled during the current month that belong to a company that has EDR and Bitdefender MDR enabled. The endpoint must have been active at least once during the current month.
For more information, refer to this kb article.
Remaining - The number of endpoints that are included in Total, but do not count toward Used.
Recent incidents. Displays the five most recent incidents reported in your managed companies. The following information is displayed for each incident:
Date and time of occurrence
Company where the incident occurred
Investigation code
Description of incident
Tip
Click any entry to go to the Reports page.
Top customers with recommendations. Displays the companies that have received the most recommendations.
Tip
Click the title to access the Recommendations page.
Click on a specific company from the list will also take you to the page and filter out the results to display only the recommendations for the company you have selected.
Top customers with open tickets. Displays the companies with the highest number of open tickets.
Tip
Click the title to view the Tickets page.
Click on a specific company from the list will also take you to the page and filter out the results to display only the tickets for the company you have selected.
Top customers with investigations. Displays the companies with the highest number of ongoing investigations.
Tip
Click the title to view the Investigations page.
Click on a specific company from the list will also take you to the page and filter out the results to display only the investigations for the company you have selected.
Overview
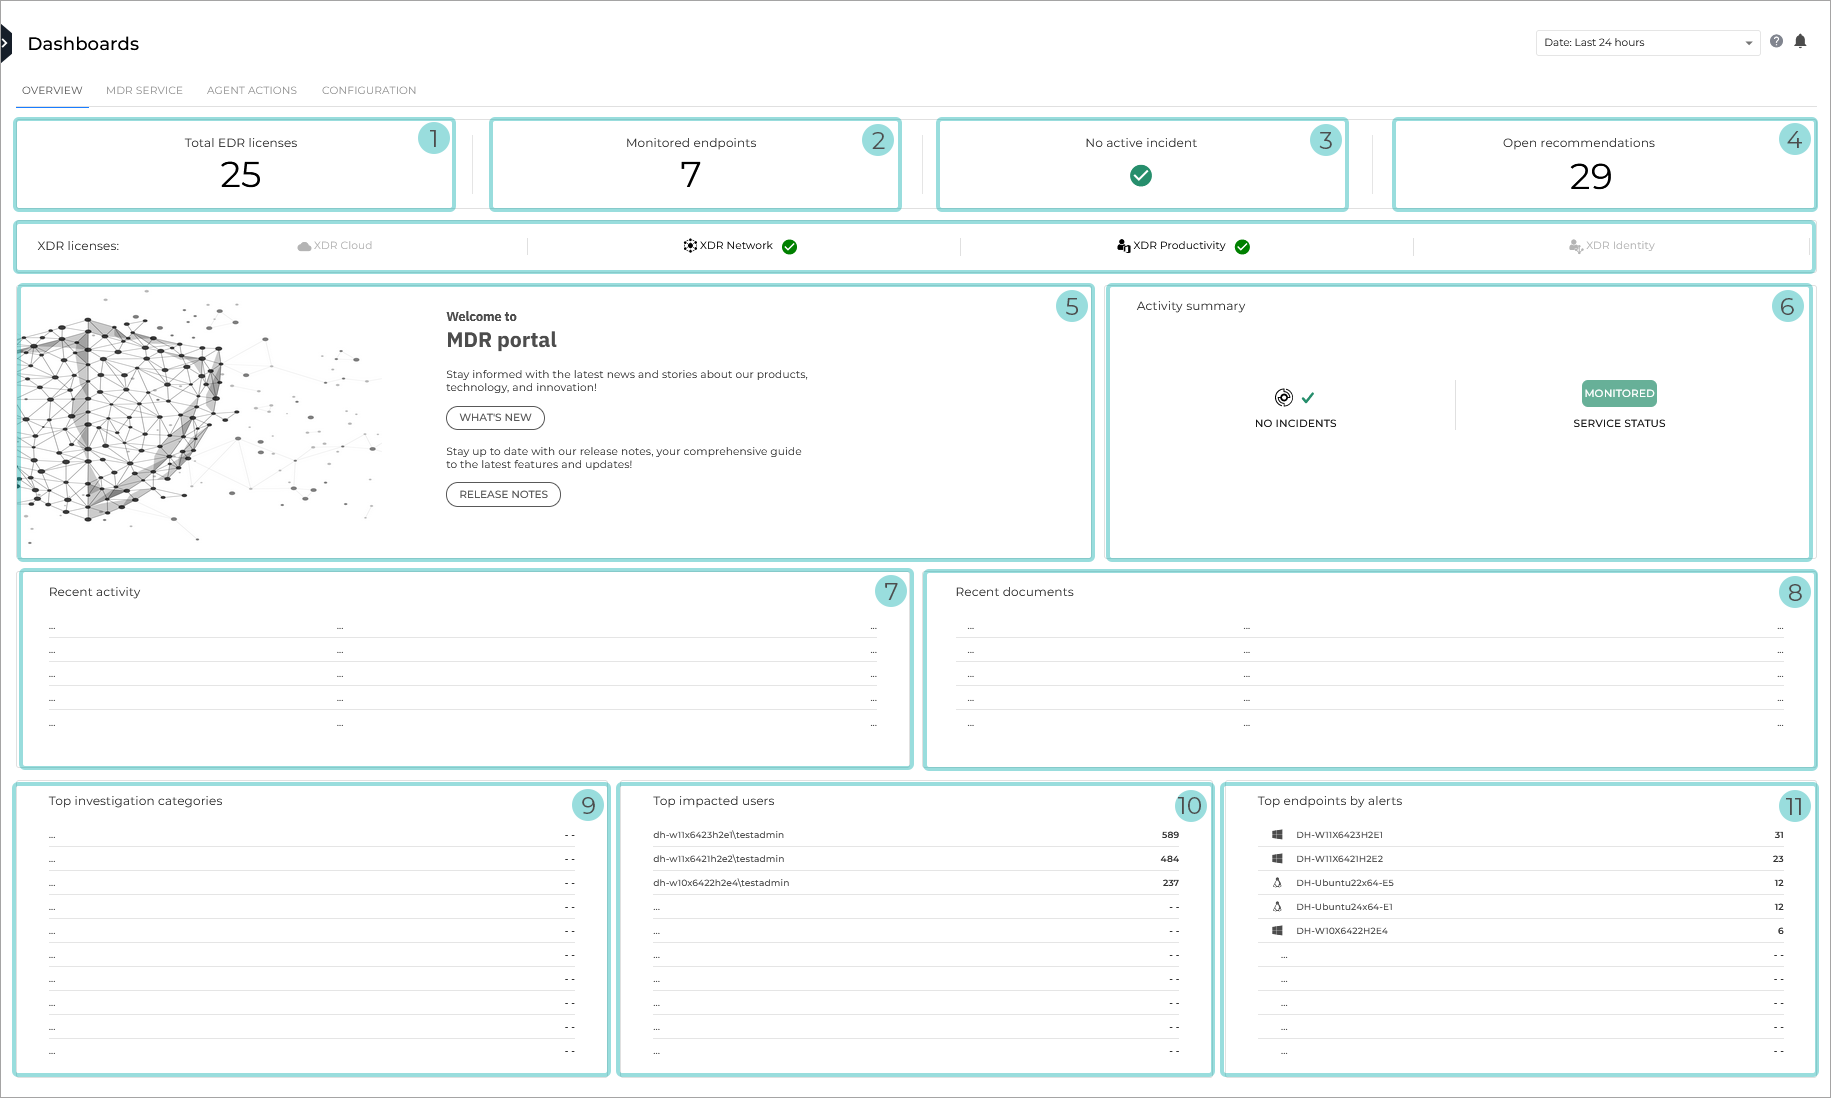
The Overview dashboard gives you a high-level view across your environment, starting with the number of licenses and monitored endpoints, a glance at the types of threats to the environment, as well as the endpoints and users who are being impacted the most.
Total EDR licenses. The total number of licenses.
Monitored endpoints. Number of endpoints protected by Bitdefender services and currently monitored by Bitdefender MDR.
Active incidents. Number of incidents which may derive from alerts in overly vulnerable environments.
Open recommendations. Number of recommendations that are currently open.
Tip
Click on the text to go to the Recommendations page.
Activity summary. Provides an overview of the most common types of activity detected on your environment over a specific period, depending on the date selection you opted for.
Tip
Hovering over any of the columns, provides an additional tool tip with useful information.
From left to right, each column indicates the following:
Environment telemetry - the number of events registered in the environment.
Suspicious events - the number of alerts generated from the total events registered in the first column.
Human analysis - the number of alerts from the previous column which resulted in investigations and threat hunts.
Analysis outcome - based on the human analysis, this column indicates the number of actions taken and recommendations.
Incidents - number of incidents resulted from the investigations.
Activity trend. Provides a timeline in the form of a a line chart of when the investigations took place and it's comprised of the following variables:
Investigations
Incidents
Hunts
Recent activity. Lists the most recent investigations, along with a timestamp and a brief description.
Tip
Click on one of the items listed to access the Investigations page.
Recent documents. Lists the most recent documents, along with a timestamp and the document type. Each document will open in a separate page, depending on the document type listed.
Top investigation categories. Shows the highest number of incidents, per category.
Tip
Click on one of the items listed to access the Investigations page.
Top impacted users. Displays a list of users with the highest number of related alerts.
Top endpoints by alerts. Displays a list of endpoints with the highest number of related alerts.
Bitdefender MDR Service
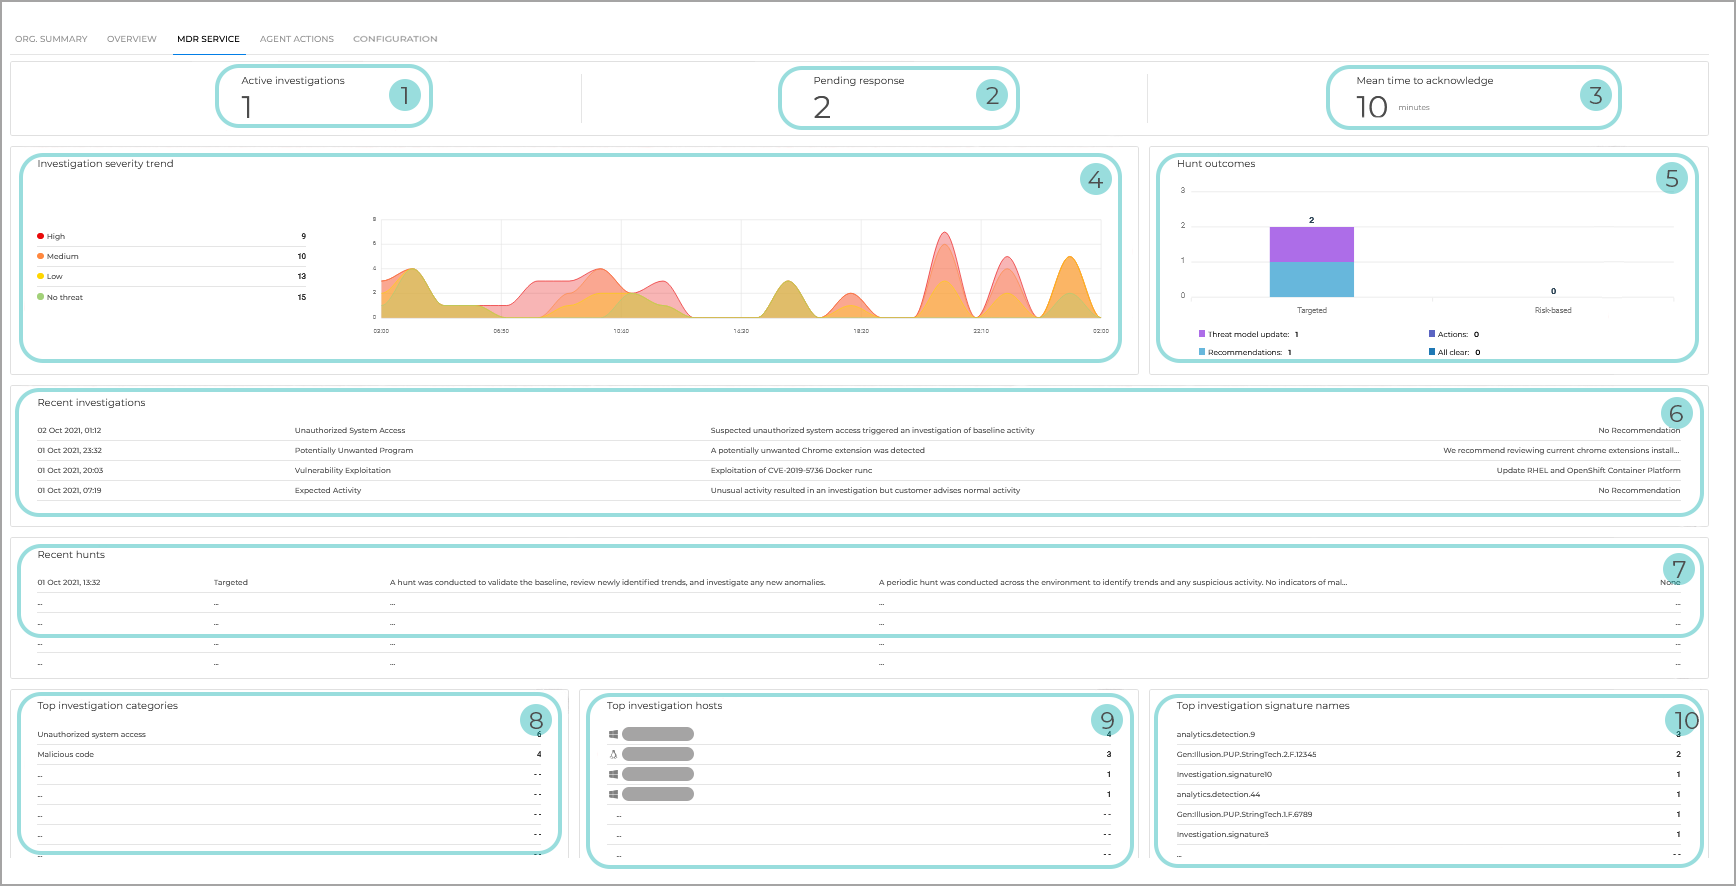
The MDR Service dashboard focuses on the actions taken by the SOC team on your behalf.
Active investigations. Number of currently ongoing investigations.
Pending response. Indicates an action you need to take in the form of a recommendation or a pre-approved action which has not yet been pre-approved and needs a response for SOC to take a certain action on your behalf. For example: quarantine an endpoint or delete a file.
Mean time to acknowledge. The average time required for an alert to result in the initiation of action.
Investigation severity trend. A list of incidents, organized per severity rating and a graph showing a timeline of recent investigations.
Hunt outcomes. A graph providing a breakdown of recent hunt results which can lead to actions and recommendations. The results are displayed in two columns:
Targeted - results from the base line of your environment created during onboarding. Original threat line created.
Risk-based - results based on external threat intelligence. For example, a new threat actor.
Recent investigations. Summary of the recent investigations.
Recent hunts. A list of recent hunts showing information about the hunt type, and a summary of that specific hunt along with action taken and recommendation, if any applicable.
Top investigation categories. Shows the highest number of incidents, grouped by category.
Top investigation hosts. Displays the hosts which were included in most of the investigations.
Top investigation signature names. Displays the signatures detected most during the investigations.
XDR for Bitdefender MDR add-ons
The following license bar is displayed on the Bitdefender MDR Portal Dashboard:
Overview dashboard for Premium and Enterprise customers.
Service dashboard for Foundations customers.

XDR add-ons:
XDR for Bitdefender MDR – Cloud
XDR for Bitdefender MDR – Network
XDR for Bitdefender MDR – Productivity
XDR for Bitdefender MDR – Identity
Note
For each of those four that the you have purchased, the icon and label will be in color. If you do not have a specific add-on and you hover over the icon and label, you will see a text box that says “You don’t have this add-on yet”.
Service
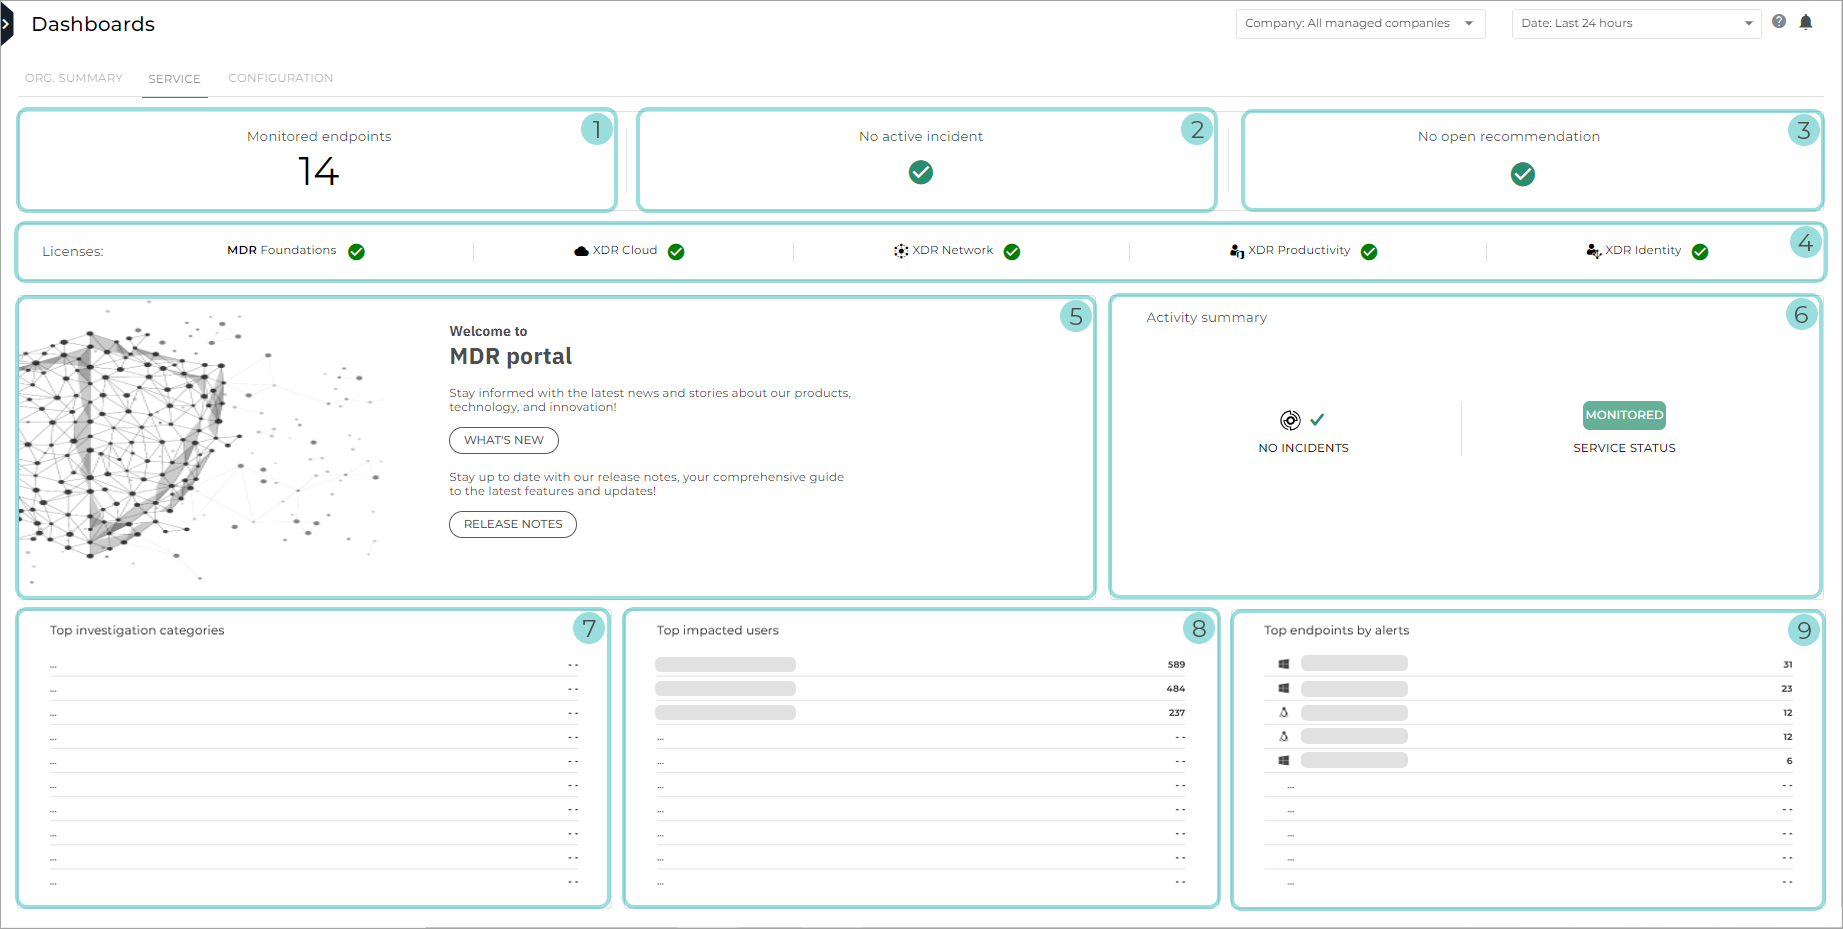
Monitored endpoints. This widget shows the number of monitored endpoints in the your environment.
Active incidents. The number of incidents which may derive from alerts in overly vulnerable environments.
Open recommendations. The number of recommendations that are currently open.
XDR licenses. License bar for XDR add-ons.
Activity summary. Provides an overview of the most common types of activity detected on your environment over a specific period.
Activity trend. Provides a timeline in the form of a a line chart of when the investigations took place and it's comprised of the following variables:
Hunts
Incidents
Investigations
Recent activity. Lists the most recent investigations, along with a timestamp and a brief description.
Top impacted users. Displays a list of users with the highest number of related alerts.
Top endpoints by alerts. Displays a list of endpoints with the highest number of related alerts.
Agent actions
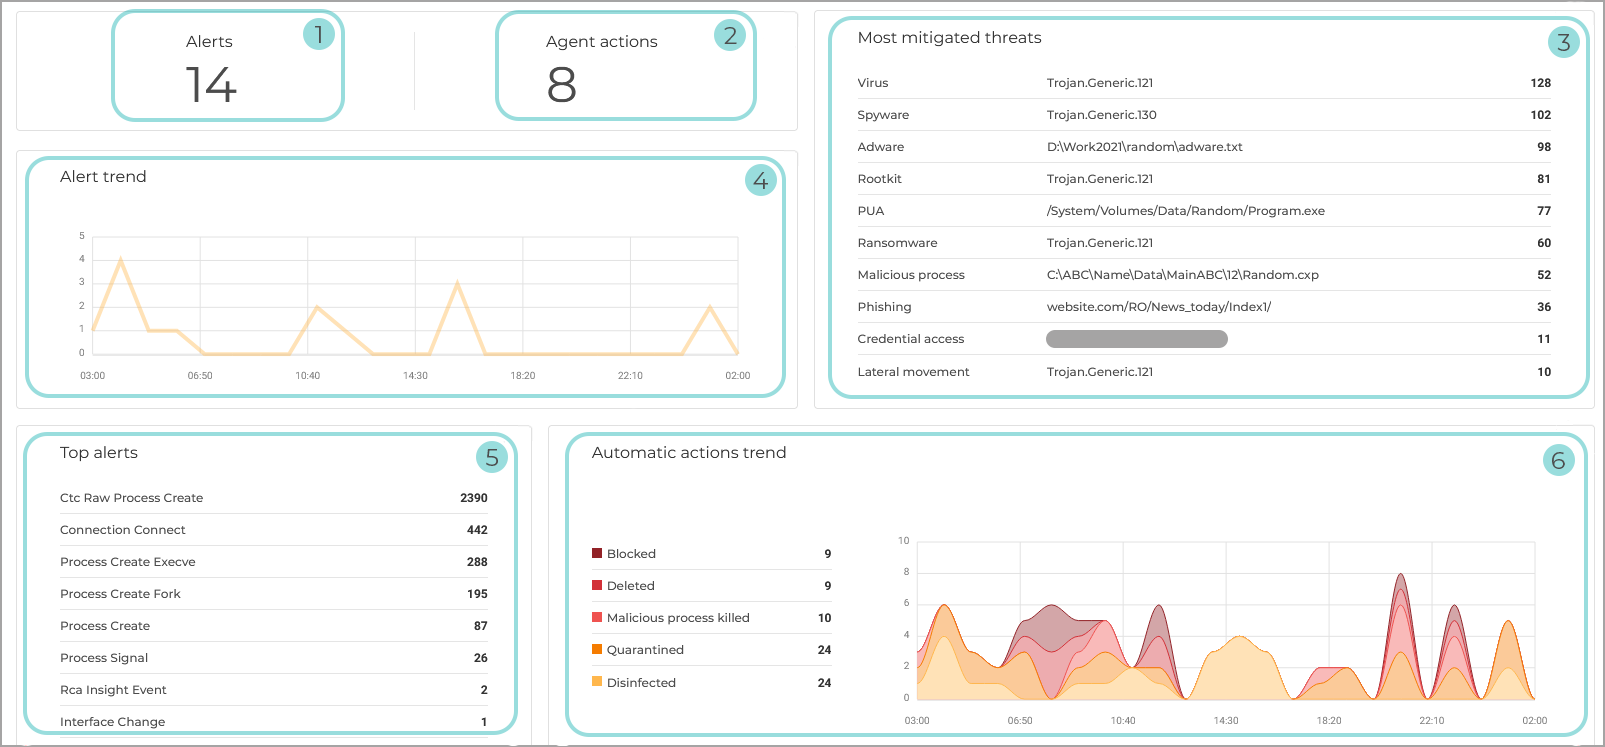
The Agent actions dashboard provides a summary of what type of alerts are coming from the endpoint agent, including how many and what types of responses the agent was able to make.
Alerts Shows the number of alerts created by agents on endpoints.
Agent actions. Shows the number of automatically actions taken, based on that number of alerts.
Most mitigated threats. Shows the most common addressed threats along with threat type and number of occurrences.
Alert trend. Shows the evolution of alerts triggered in the selected time interval. The trend may follow a weekly pattern, high during the working days, and low during non-working days.
Top alerts. Displays the highest number of alerts by type.
Automatic actions trend. Provides an overview of actions taken by the agent. For example:
Block
Block and Disinfect
Delete
Quarantine
Disinfect Only
Malicious process killed
Configuration
For MDR Premium and Enterprise
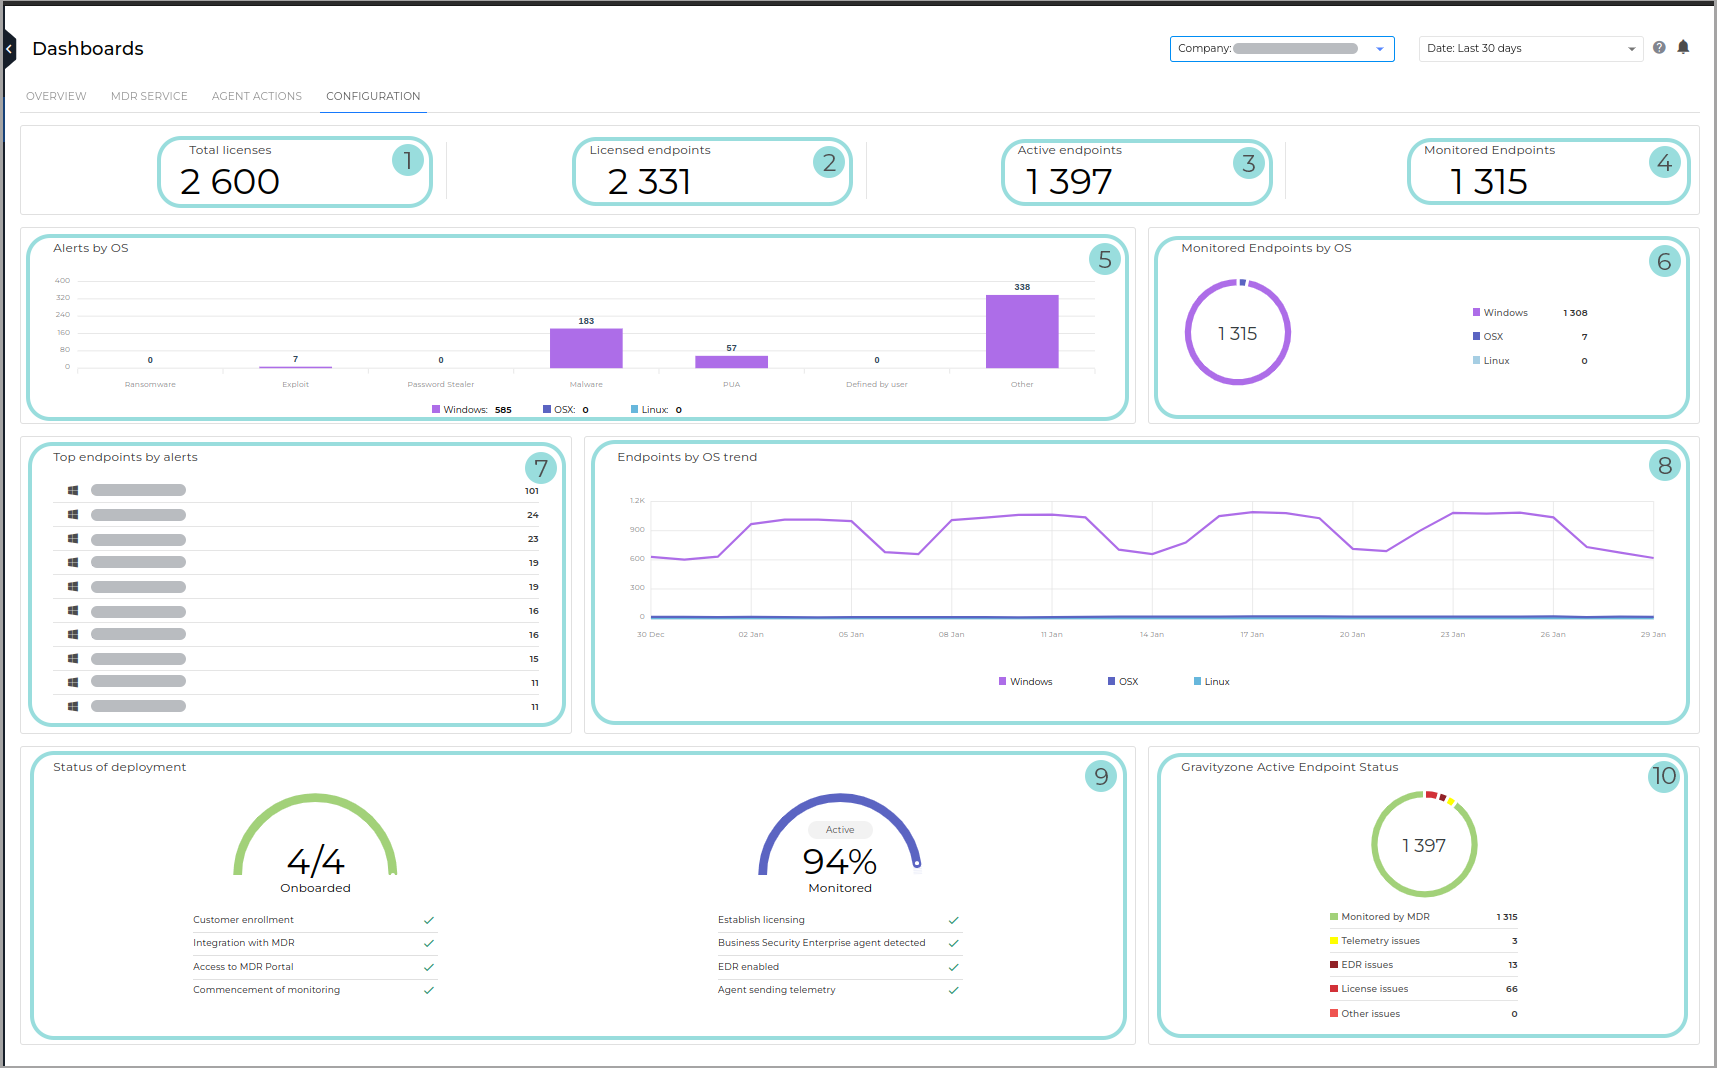
Total licenses. The total number of endpoints licensed in GravityZone for all managed companies.
Licensed endpoints. The total number of endpoints that are currently using a license in GravityZone.
Active endpoints. The number of endpoints from managed companies that have been online at least once in GravityZone within the time period of the dashboard.
Monitored endpoints. The number of active endpoints that have sent telemetry data to MDR at least during the current month.
Alerts by OS. This widget shows the number of alerts in the your environment over the period of time specified by the dashboard time selector, grouped by operating system.
Monitored Endpoints by OS. This widget shows the number of monitored endpoints in the your environment over the period of time specified by the dashboard time selector, grouped by operating system.
Top endpoints by alerts. Displays a list of endpoints with the highest number of related alerts.
Endpoints by OS trend. This widget shows the number of active endpoints in the your environment over the period of time specified by the dashboard time selector, grouped by operating system.
Status of deployment. Displays the overall progress of:
Onboarding - setting up and configuring infrastructure within the Bitdefender environment so that endpoints can be monitored. There are four phases, which will appear as either complete or incomplete:
Customer enrollment
Integration with Bitdefender MDR
Access to Bitdefender MDR Portal
Commencement of monitoring
Note
Once all steps are complete, the status for the Deployment widget will change from Onboarding to Active. This indicates that endpoints that have been correctly deployed are now monitored.
Deployment. Establishing a telemetry pipeline, by following these four milestones for at least one endpoint in your company:
Establish licensing
Business Security Enterprise agent detected
EDR enabled
Agent sending telemetry
The percentage displayed indicates how many of your company's endpoints that are currently active in the GravityZone console are also monitored by the Bitdefender MDR Security Operations Center.
GravityZone Active Endpoint Status - provides a breakdown of all your company's endpoints that are active in the GravityZone console, based on whether or not (and why) they are also monitored by Bitdefender MDR. The widget displays the following information:
The total number of active endpoints available in the GravityZone console.
Monitored by MDR - The total number of endpoints for which telemetry has been received and which don’t have EDR, licensing, telemetry, or any other issues.
The rest of the endpoints are split into the following categories, based on what configuration issue is preventing them from being monitored by Bitdefender MDR:
EDR issues - the endpoint does not have EDR deployed or enabled.
License issues - the endpoint is not licensed or that the license has expired.
Telemetry policy issues - the endpoint is not sending telemetry information to the Security Operations Center. Contact support to resolve this issue.
Other issues - any issue not included in the above categories. Contact support to resolve this issue.
Note
Clicking on any of the items in the widget will download a list containing information on all the endpoints that are included under that category.
For MDR Foundations
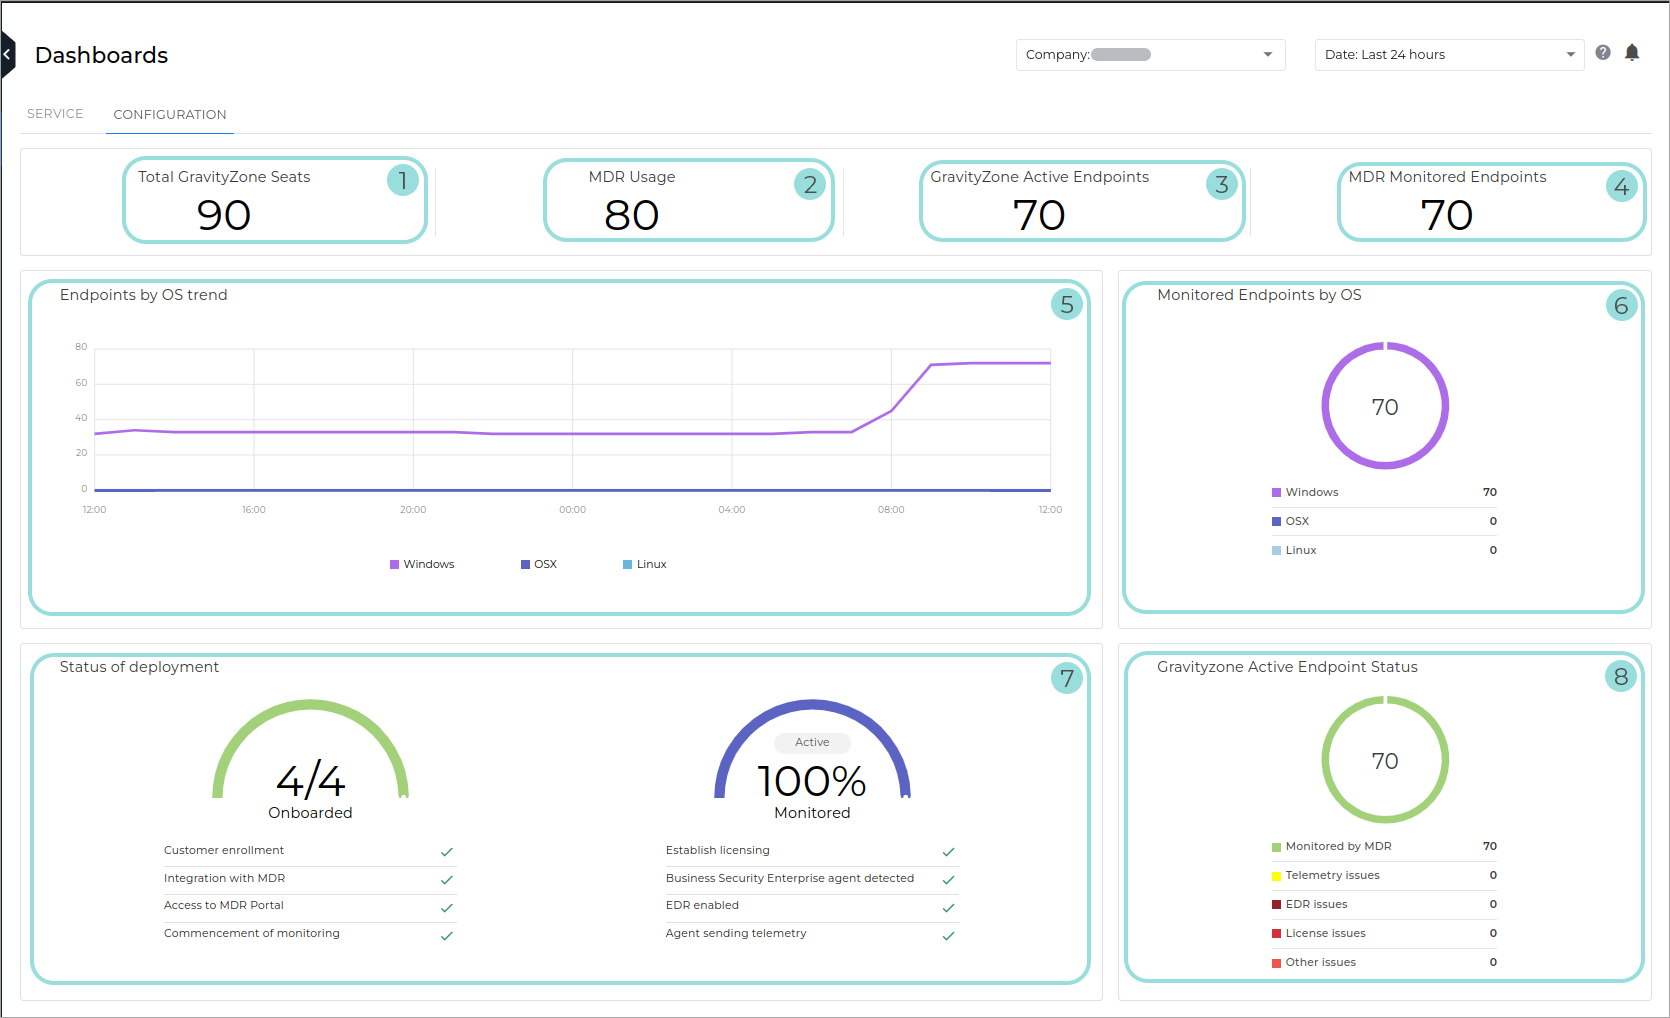
Total GravityZone Seats. The total number of reserved seats, if available.
If not seats are reserved for the company, the monthly endpoint usage is displayed for the current month.
MDR usage. The number of endpoints that have had EDR enabled during the current month that belong to a company that has EDR and Bitdefender MDR enabled. The endpoint must have been active at least once during the current month.
For more information, refer to this kb article.
GravityZone Active Endpoints. The number of endpoints from managed companies that have been online at least once in GravityZone within the time period of the dashboard.
MDR Monitored Endpoints. The number of endpoints from managed companies that have been online at least once in GravityZone within the time period of the dashboard.
Endpoints by OS trend. This widget shows the number of active endpoints in the your environment over the period of time specified by the dashboard time selector, grouped by operating system.
Endpoints by OS. Displays all endpoints, grouped per installed operating system.
Status of deployment. Displays the overall progress of:
Onboarding - setting up and configuring infrastructure within the Bitdefender environment so that endpoints can be monitored. There are four phases, which will appear as either complete or incomplete:
Customer enrollment
Integration with Bitdefender MDR
Access to Bitdefender MDR Portal
Commencement of monitoring
Note
Once all steps are complete, the status for the Deployment widget will change from Onboarding to Active. This indicates that endpoints that have been correctly deployed are now monitored.
Deployment. Establishing a telemetry pipeline, by following these four milestones for at least one endpoint in your company:
Establish licensing
Business Security Enterprise agent detected
EDR enabled
Agent sending telemetry
GravityZone Active Endpoint status - provides a breakdown of all your company's endpoints that are active in the GravityZone console, based on whether or not (and why) they are also monitored by Bitdefender MDR. The widget displays the following information:
The total number of active endpoints available in the GravityZone console.
Monitored by MDR - The total number of endpoints for which telemetry has been received and which don’t have EDR, licensing, telemetry, or any other issues.
The rest of the endpoints are split into the following categories, based on what configuration issue is preventing them from being monitored by Bitdefender MDR:
EDR issues - the endpoint does not have EDR deployed or enabled.
License issues - the endpoint is not licensed or that the license has expired.
Telemetry policy issues - the endpoint is not sending telemetry information to the Security Operations Center. Contact support to resolve this issue.
Other issues - any issue not included in the above categories. Contact support to resolve this issue.
Note
Clicking on any of the items in the widget will download a list containing information on all the endpoints that are included under that category.