The Network sensor
The Network sensor collects and pre-processes network-related events in order to enrich the context of your incidents.
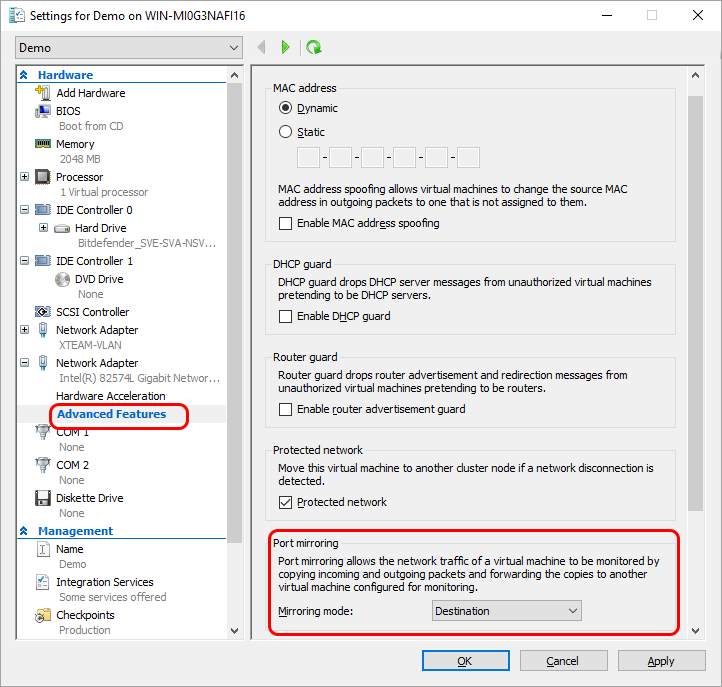
It is configured in TAP mode and gets a copy of the network traffic via a SPAN port. It can detect any type of device that communicates via IPv4 or IPv6 network protocols, regardless of whether the device is managed by Bitdefender or not. If there are any IoT devices on the network that communicate using those same protocols, the Network sensor will inspect that traffic as well.
For more information about the Network sensor requirements, refer to the Network sensor requirements page.
For optimal results, it is recommended you implement one network sensor appliance per network subnet.
Note
The Network sensor does not support SCADA or any particular OT protocols.
After configuration, the Network sensor continuously listens to network traffic, collects events from all endpoints in your environment, pre-processes and pre-filters them, and sends both metadata and detections to GravityZone Security Analytics engine.
View the triggered detections in the Incidents > Search section, by using the following query: other.sensor_name:network. These detections are used to enrich the context of Extended Incidents generated by GravityZone.
To add the Network sensor, follow these steps:
Install the Network sensor
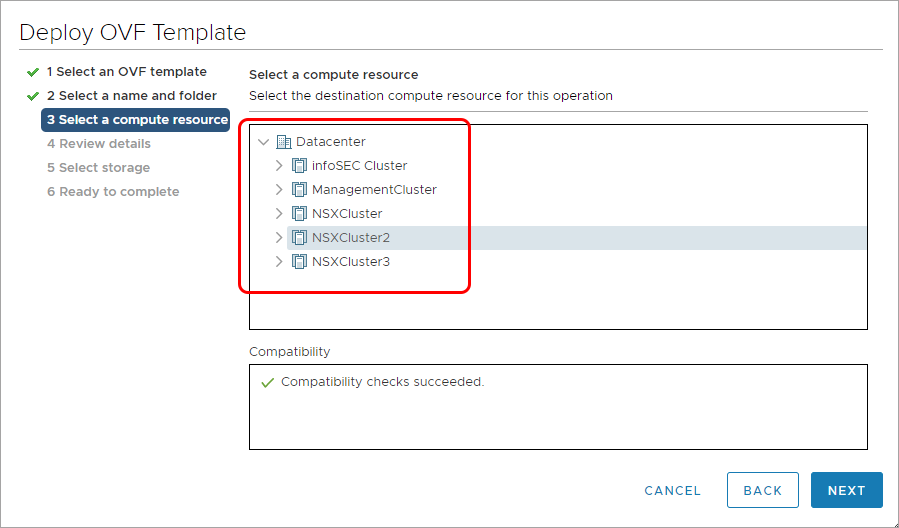
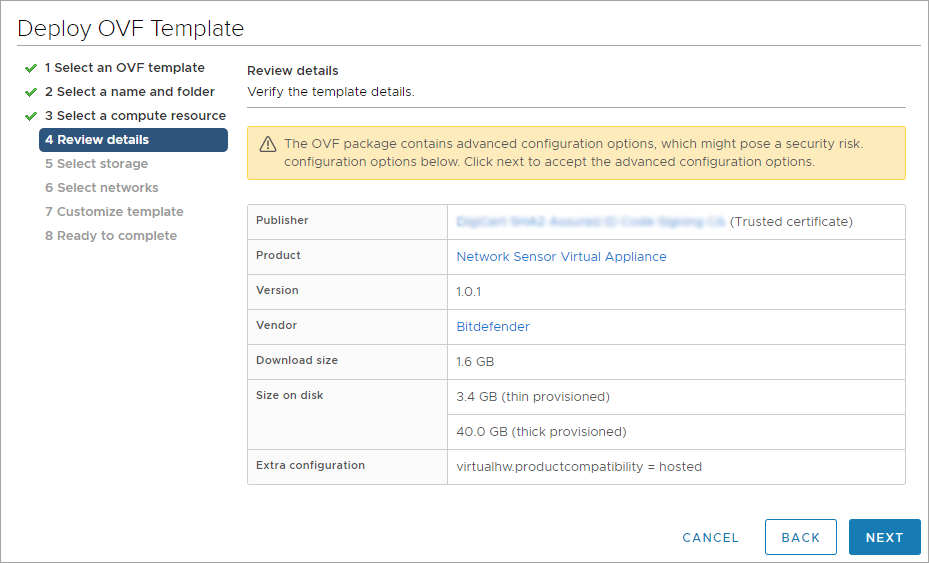
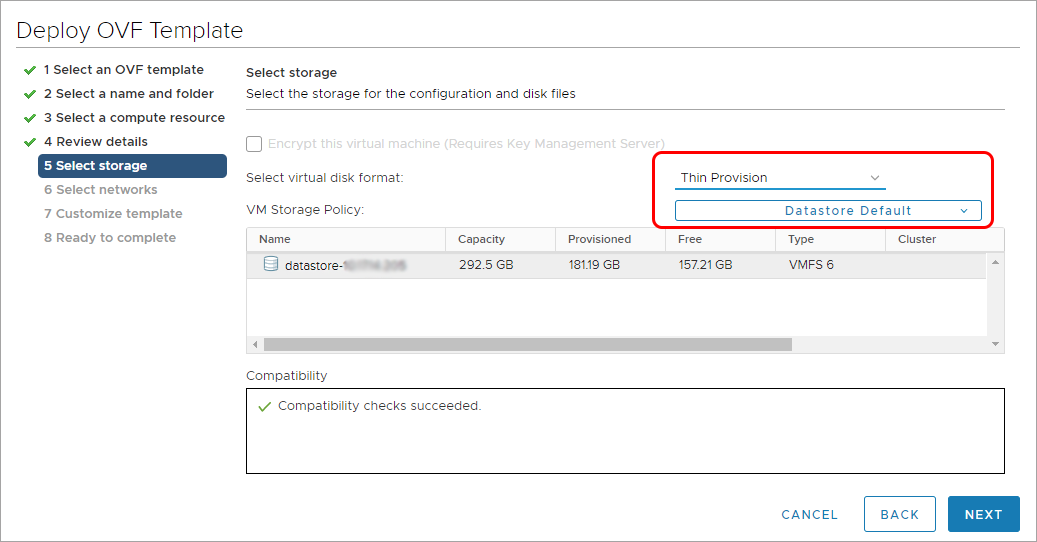
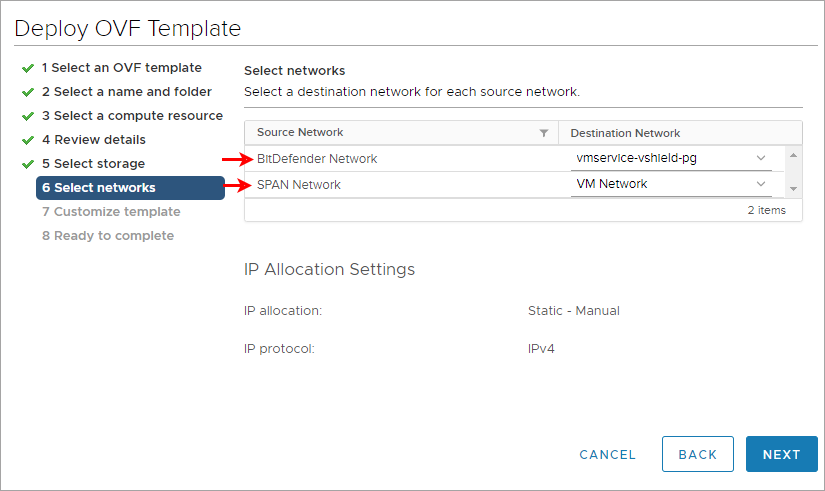
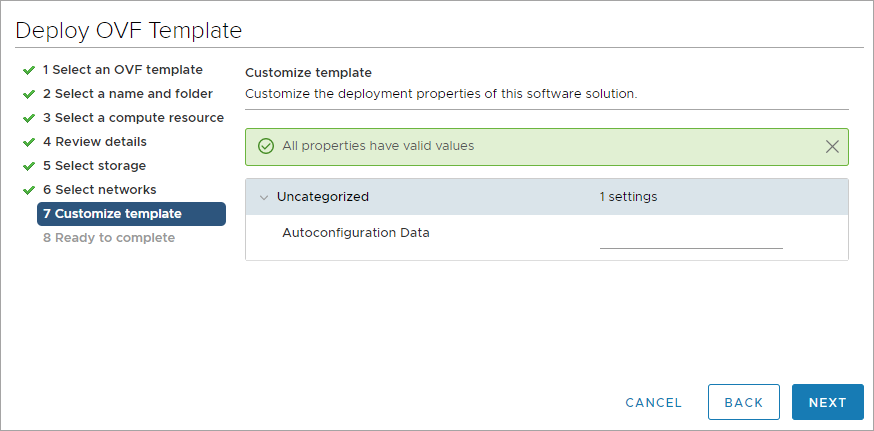
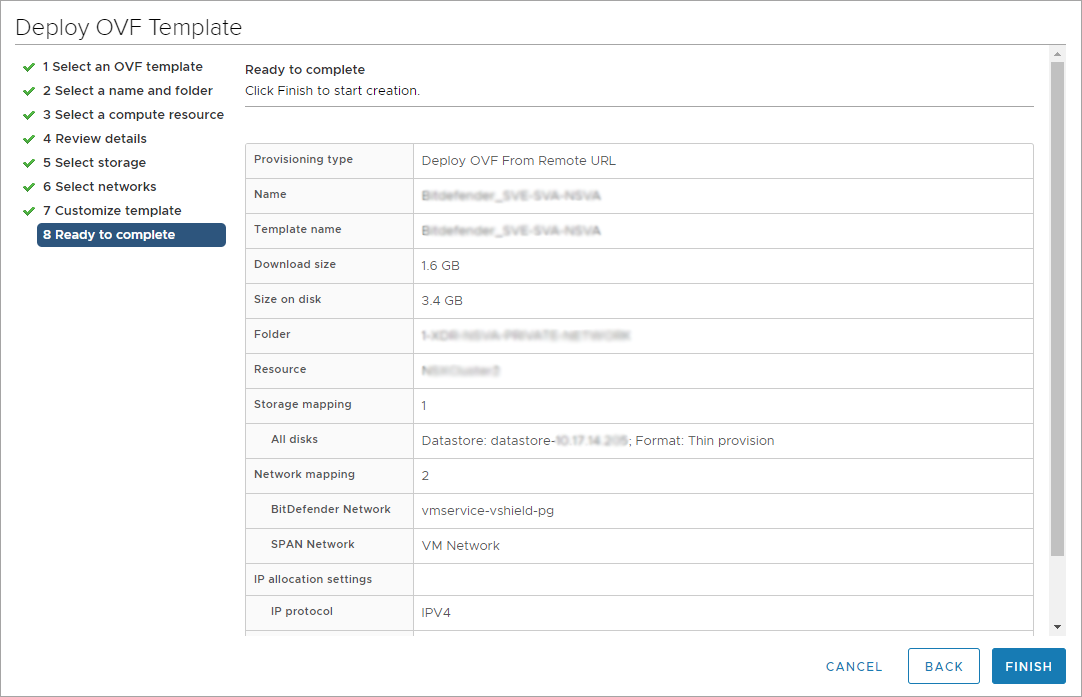
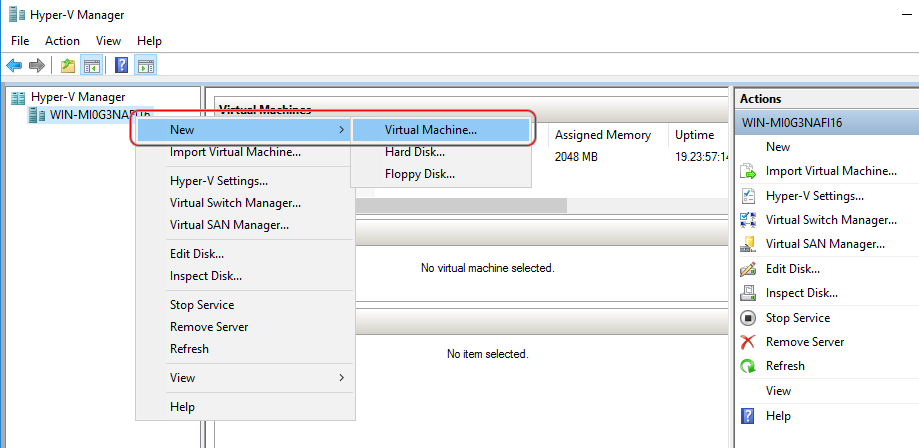
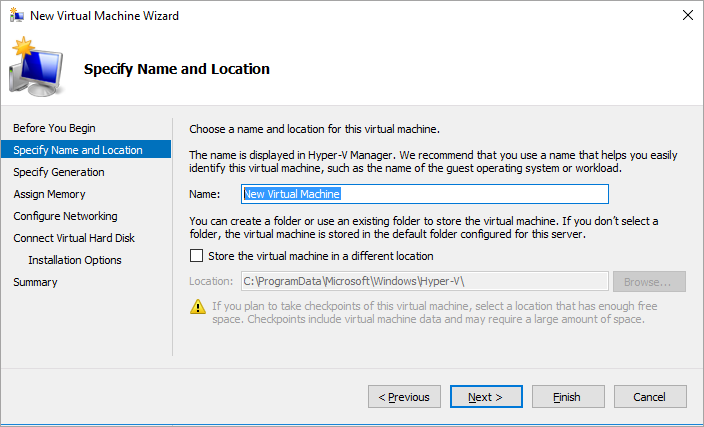
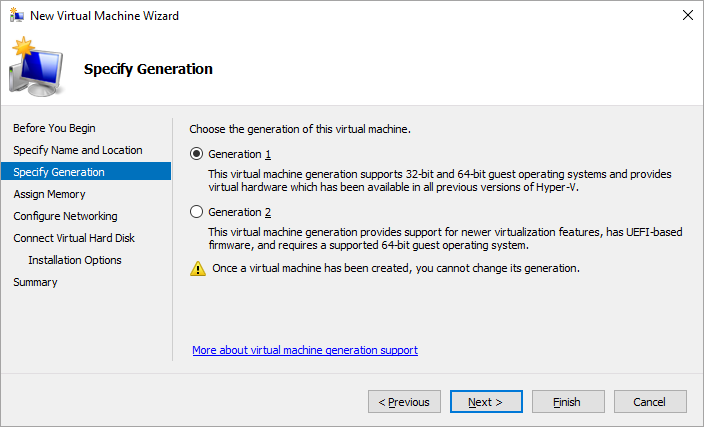
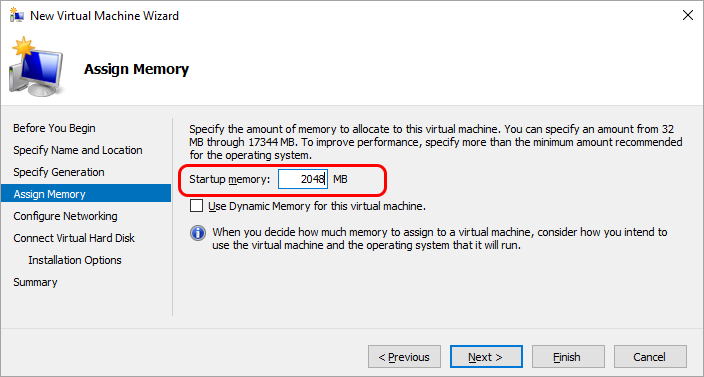
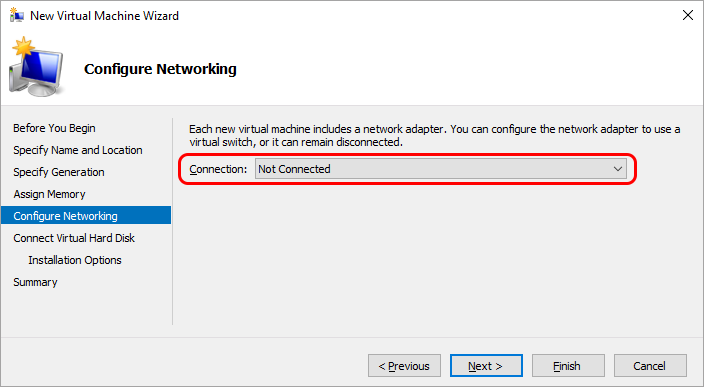
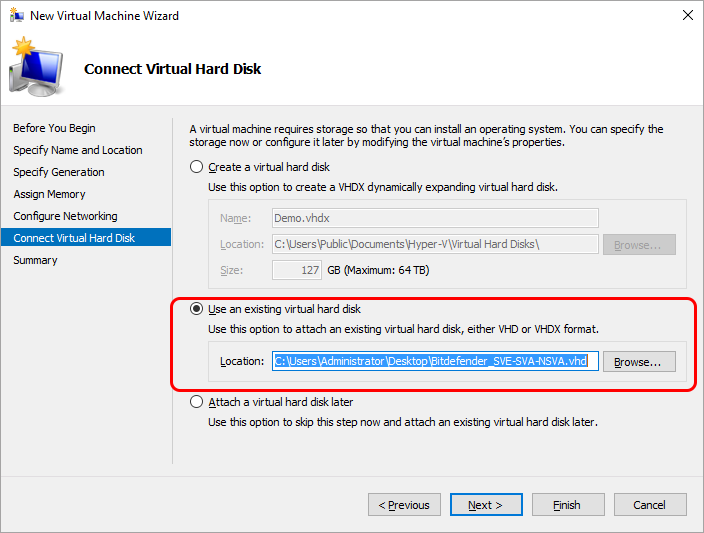
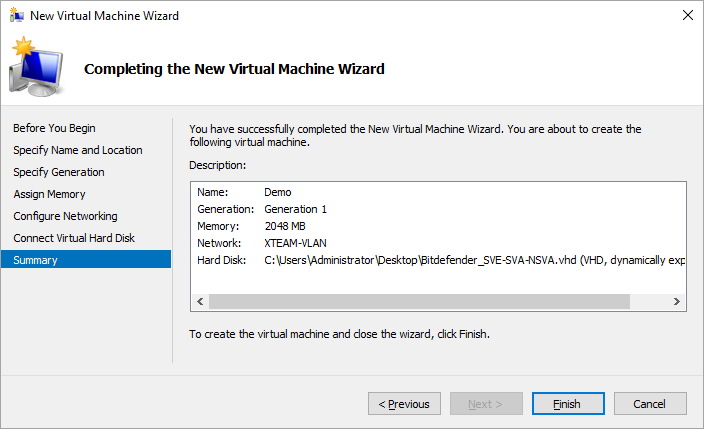
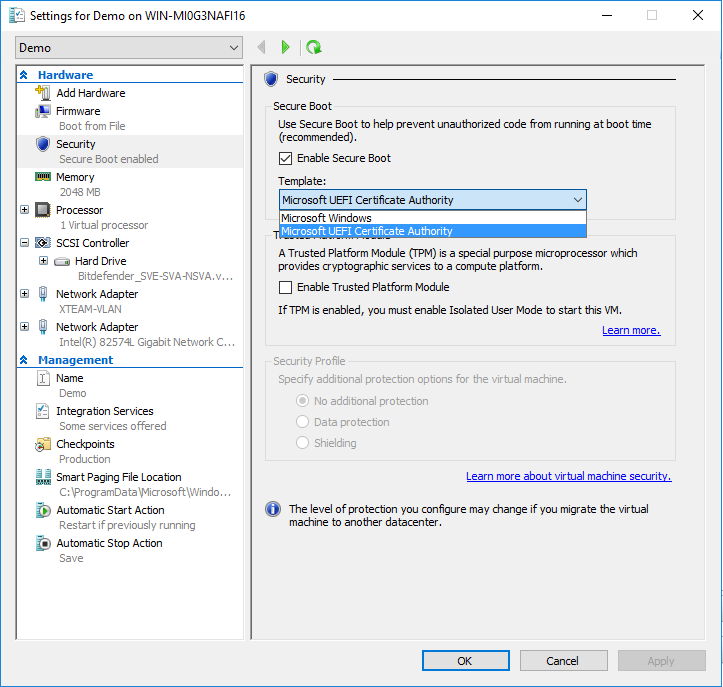
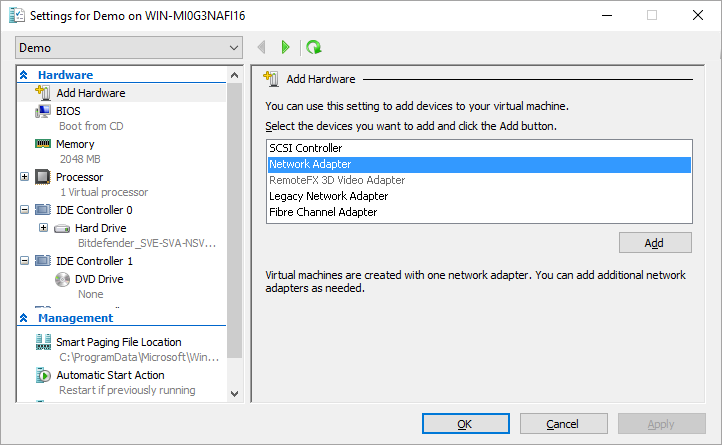
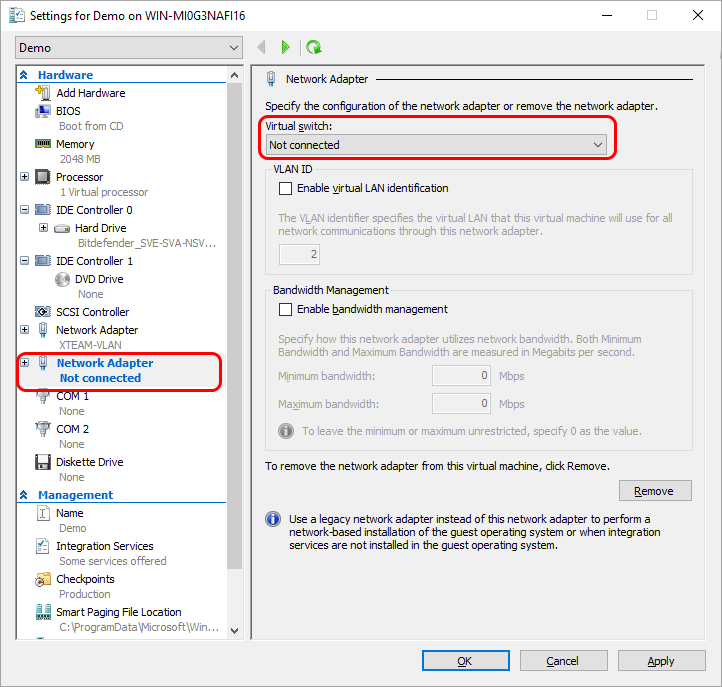
Deploy the Network sensor kit in your environment by using either vSphere or Hyper-V.
Configure the Network sensor virtual appliance
After installing the Network sensor, follow these steps to configure the virtual appliance:
Start the Network sensor virtual machine (using either vSphere client or Hyper-V Manager).
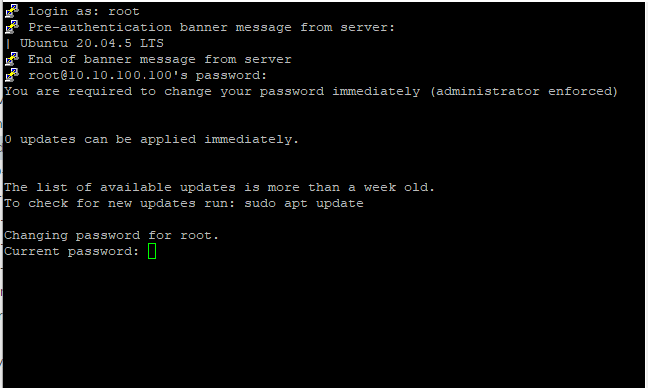
Log in via SSH using
root / sveas username and password.Change the password.
The default password does not meet the new security password requirements, so you have to change it. It must contain at least 8 characters, one digit, at least one upper case character, at least one lower case character, one special character and must be changed every 3 months.
Note
For more information about resetting the root password, refer to Reset root password for Security Server.
To configure the Network sensor, run the following command:
/opt/bitdefender/bin/sva_setup.sh
Start the configuration process.
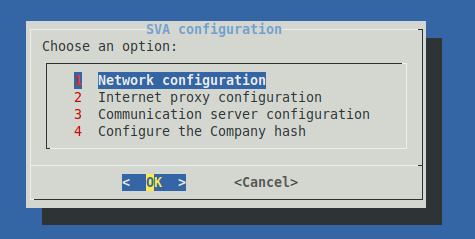
Choose an option from:
Network configuration - allows setting the following modes:
eth0: this is the primary interface used in the Dynamic Host Configuration Protocol (DHCP) mode to enable communication with GravityZone.eth1: this is the interface in promiscuous mode, used to analyze network traffic.
The subnet of the monitored network on the promiscuous interface must be configured:
Select Network configuration.
Select the promiscuous interface. By default it is
eth1.
Configure the monitored subnet address using the CIDR notation:

Select the configuration mode for the primary interface:

If no change is needed, select 1. DHCP (current).
If the primary interface must have static IP address, select 2. Static and complete the configuration:

Internet proxy configuration - allows setting a proxy configuration that will be used the first time the Network sensor communicates with GravityZone .
Go to Communication server configuration and select one of the following options, based on your browser's URL:
For
cloudgz.gravityzone.bitdefender.com: GZ Cloud Instance 1For
cloud.gravityzone.bitdefender.com: GZ Cloud Instance 2
Configure the Company hash - the GravityZone company hash where the Network sensor sends the data (Login to GravityZone > My Company > My Company hash).
If the connection is successful, the Network sensor will be displayed in the GravityZone platform, in Network > Computers and Groups( in approximately 30 seconds).

The Network sensor main log file can be found here:
/opt/bitdefender/var/log/bdxdrd.log
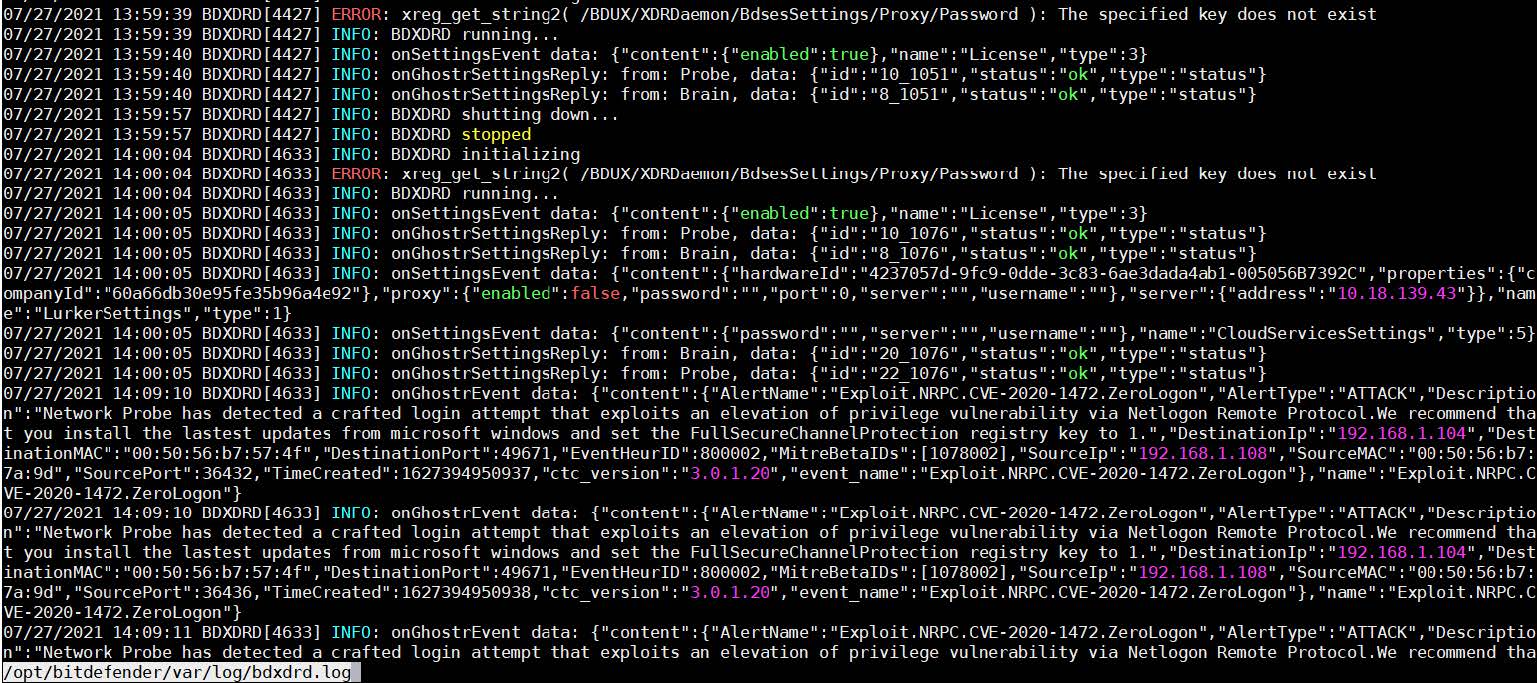
View the triggered detections in the Incidents > Search section, by using the following query: alert.type:ghoster.
If you encounter any issues with your Network sensor, you can collect debug logs and contact Bitdefender Enterprise Support for assistance.

